Market demand curve for a commodity is the horizontal sum of individual demanded curves of all the buyers in a market. This is illustrated with the help of the market demand schedule given above.
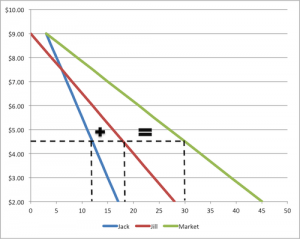
Figure: Market Demand Curve
The market demanded curve for a commodity, like the individual demand curve is negatively sloped, (see figure 3.3). It shows that under the assumptions (ceteris paribus) other things remaining the same, there is an inverse relationship between the quantity demanded and its price. At priced of TK. 10, the quantity demanded in the market is 40 thousand units at price of TK. 2, it increases to 180 thousand units.
In the other words, the lower the price of the good X, the greater is the demand for it ceteris paribus.