The market supply data of the commodity X as shown in the supply schedule is now presented graphically.
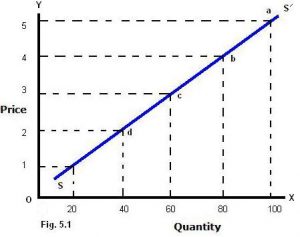
Figure: Supply Curve
In the figure (4.1) price is plotted on the vertical axis and the quantity supplied on the horizontal axis. The five points show
Page no.75
each price quantity combination. The supply curve slopes upward from left to right indicating that less quantity is offered for sale at lower price and more quantity at higher prices. Each of the points shows the combination of price and quantity supply.
Formula for Law of Supply Function:
The supply function can also be expressed in symbols.
Qxs=f (px, Tech, Si, F n, x,………..)
Here:
Qxs=Quantity supplied of commodity x by the producers.
f= Function
Px=price of commodity x.
Tech= Technology.
Si= Supplies of inputs.
Fn = Features of nature.
X = Taxes/Subsidies.
Four non-price factors indicate that these variables also affect the supply but they are held constant.