Individual’s Demand Curve:
Demand curve is a graphical representation of the demand schedule. According to Lipsey:” This curve, which shows the relation between the price of a commodity and the amount of that
Commodity the consumer wishes to called demand curve:
It is a graphical representation of the demand schedule.
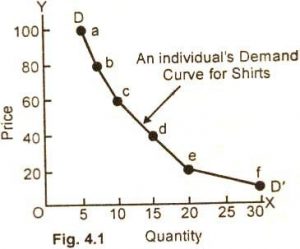
Figure: Demand Schedule
In the figure 3.2 the quantity demanded of shirts in plotted on horizontal axis and price is measured on vertical axis. Each price quantity combination is plotted as a point on this graph. If we join the price quantity points we get the individual demand cure for shirts.
The demand curve slopes downward from left to right,. It has a negative slope showing that the two variables price and quantity work in opposite direction. When the price of a good rises, the quantity demanded decreases and when its price decreases, quantity. Demanded increases, ceteris paribus.